|
|
YEASTRACT+ |
|
| Home > Tutorial | Contact/Credits Tutorial Help |
|
|
YEASTRACT+ |
|
| Home > Tutorial | Contact/Credits Tutorial Help |
|
|
Tutorial
N.C. Yeastract (Non-Conventional Yeast Search for Transcriptional Regulators And Consensus Tracking; http://yeastract-plus.org/ncyeastract/) database presently contains regulatory associations between transcription factors and target genes in non-conventional yeast species biotechnologically relevant, based on bibliographic references. Each regulation has been annotated manually, after examination of the relevant references. Further information about each yeast gene was obtained from the respective Genbank genome assembly, and Gene Ontology was either annotated using the Blast2GO software [1] or retrieved from the fungal genomes browser Ensembl Fungi [2]. Additionally, orthology associations between the all the non-conventional yeast species added to the database and S. cerevisiae were inferred with the software OrthoFinder [3] and Proteinortho [4]. N.C. Yeastract database assists in three major issues: prediction of gene transcriptional regulation and global expression analysis in yeasts considered biotechnologically relevant according to the transcription networks described in the literature. This tutorial presents three case-studies, exemplifying the use of different query options and utilities. Various other ways to exploit available options and utilities are possible. - Example 1: Gene expression analysis based on regulatory associations - Example 2: Prediction of transcription factor DNA binding sites based on promoter analysis Throughout N.C Yeastract database and this tutorial, the regulatory associations are denominated "Documented" or "Potential":
The accuracy and updating of the information gathered, curated and inserted in this database is crucial to N.C. Yeastract users. Thus, we will value any contribution from the yeast community to achieve this goal. The results presented for this Tutorial were computed on July 2019. However, due to subsequent updates the current ranking may differ from the presented one. Example 1: Gene expression analysis based on regulatory associations N.C. Yeastract provides tools for the classification and grouping of large lists of genes of interest, such as those found up- or down-regulated under a specific environmental cue or genetic mutation, as suggested by genome-wide expression data inspection. These analyses are based on known or algorithmically identified potential regulatory associations, deposited in the N.C. Yeastract database, or on shared Gene Ontology (GO) terms. 1.1 - Rank by Gene Ontology (GO) The grouping of genes based on the shared GO terms is a feature common to several gene expression analysis software and is also implemented in N.C. Yeastract. To exemplify this utility, we used the list of proteins whose expression was seen to change in Z. bailii cells exposed to acetic acid in a ZbHaa1 dependent manner [5]. The grouping of this gene list, based on the Molecular Function ontology (Biological Process or Cellular Component can also be selected), and considering only the GO terms associated to more than 5% of the genes in the list, is shown in the following table:
Based on the % of genes associated to each GO term, the first hit is "Inorganic anion transmembrane transporter activity". Considering, however, a GO term enrichment analysis perspective, the GO term "unfolded protein binding" shows up together with "identical protein binding" as the ones with a lower p-value. Both criteria, however, appear to favor the idea that acetic acid leads to protein denaturation and misfolding possibly as a result of intracellular acidification in Z. bailii cells. Example 2: Prediction of transcription factor DNA binding sites based on promoter analysis TODO Comparative genomics allows the implementation of various approaches for finding regulatory elements. In N.C. Yeastract, the user can make use of the known transcription factors binding motif sequences of a given yeast species to infer regulatory associations. Using the "Promoter Analysis" tool in N.C. Yeastract/zbailii considering the TF binding sites from S. cerevisiae, and, as example, the gene ZBIST_0509 (YGP1) – described to be regulated by ZbHaa1 in Z. bailii and S. cerevisiae [6], and Haa1 in S. cerevisiae [7] in response to acetic acid stress – we obtain a table displaying a list of transcription factors that have a binding sequence in the considered promoter regions (first 1000 bp upstream of the START codon). The resulting table is organized into two main columns - "Uniquely in species" and "On all orthologs" - (Figure 2). The former contains the transcription factors that only have a putative binding site in the promoter of that gene in a given yeast species (example: Abf1 has only a putative binding site in the promoter of ZBIST_0509 from Z. bailii, but not in YGP1 from S. cerevisiae). The "On all orthologs" column contains the transcription factors that have a putative binding site in the promoter regions of all the orthologs of a given gene. Additionally, the user may also visualize the putative binding sites located at the promoter of the queried genes and respective orthologs by selecting "Promoter" in the column "Find Binding Sites".
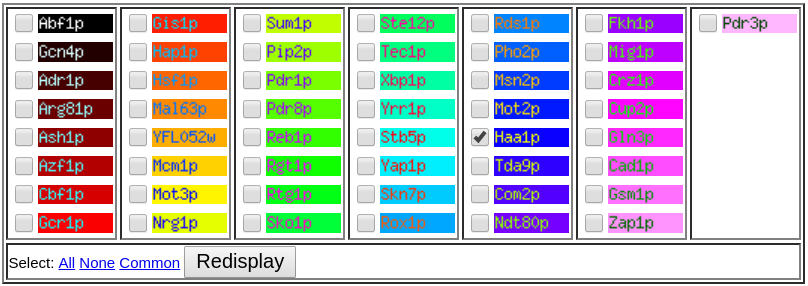
In the "Search Transcription Factors" page is possible to select the display of the binding sites for specific, all, none or common transcription factors among the queried gene and respective orthologs. Since YGP1 is described to be regulated by ZbHaa1 and Haa1 we can narrow our search for the binding sites of Haa1 in the promoter regions of ZBIST_0509 and its S. cerevisiae ortholog YGP1 (Figure 3). This way we can make a raw prediction of a possible localization of a ZbHaa1 binding site on the promoter of the queried gene based on the Haa1 binding site information.
Comparison of interspecies regulatory networks can be useful to identify functional elements without previous knowledge of function as well as identify significant evolutionary changes regarding transcriptional regulatory mechanisms. In N.C. Yeastract, the user can search for common and unique transcription regulatory associations and obtain the respective comparative networks of biotechnologically relevant non-conventional yeast species with the yeast model S. cerevisiae using the query "Network comparison". To exemplify this utility, we used the documented ZbHaa1- and Haa1- regulons in response to acetic acid stress [5], [7] in N.C. Yeastract/zbailii. The results of this query are three regulatory networks (Common, Unique to Zygosaccharomyces bailii IST302 and Unique to Saccharomyces cerevisiae S288c). It is important to note that the classification of a common regulatory association (represented in blue) can be done by choosing a determined environmental condition (in this example stress by weak acids) but does not have into account the supporting evidence (DNA binding and/or Expression) or type of association (Positive, Negative or Unspecified). Considering this, as a complementary feature, the user also has the option to visualize the complete regulatory networks of either S. cerevisiae or Z. bailii considering the environmental condition, supporting evidence and association type and therefore having the possibility to compare with any of the obtained networks. Furthermore, there is also the option to toggle on the display of additional regulatory associations between TFs; this will consider the regulatory associations described for all the transcription factors among the queried target genes. For example, HSP26 (regulated by Haa1) is also described to be regulated by Msn4 in response to weak acid stress, which in turn is regulated by Haa1, and therefore, the regulation will only be displayed if the aforementioned option is selected, otherwise, it will not be classified as a unique regulatory association. The common network displays the transcriptional regulations in common between Z. bailii ZbHaa1 and S. cerevisiae Haa1 based solely on the selected environmental condition and the regulation and orthology data present in the database. In the case of weak acid stress condition, we can make a comparison of the aforementioned transcription factors regulons to find possible genes of interest. This way, ZbHaa1, and Haa1 have two regulatory associations in common (HSP26 and YGP1) (Figure 4A). In Z. bailii, HSP26 is present in four copies - ZBIST_0079 (ZbHSP26), ZBIST_3334 (ZbHSP26-1), ZBIST_3442 (ZbHSP26-2) and ZBIST_4487 (ZbHSP26-3) - and we can observe that only two of these (ZbHSP26 and ZbHSP26-2) are regulated by ZbHaa1 in conditions of stress by weak acid; these two genes together with ZbYGP1 might be interesting to explore in the context of increasing tolerance to weak acids and to understand the underlying mechanisms that confer Z. bailii with an extremely high tolerance to acetic acid. It is important to note that the output obtained using the query "Network comparison" regarding the common networks will be different in terms of visualization depending on the database we are working in (N.C. Yeastract or Yeastract). For instance, using genes belonging to the ZbHaa1 and Haa1 regulons in response to acetic acid in Yeastract will result in a common network displaying three blue arrows (Figure 4A) whereas the same group of genes used in N. C. Yeastract will result in a common network displaying two blue arrows (Figure 4B). The result is the same, but in the former case, we have as a base S. cerevisiae genes whereas in the latter the base are Z. bailii genes, therefore, orthology relationships will affect the network visualization and users should be aware of that when using both databases.
References
|
||||||||||||||||||||||||||||||||||||||||||||||||||||||||||||||||||||||||||||||||||||||||||||||||||||||||||||||||||||||||||||||||||||||||||||||||||||||||||||||||||||||||||||||||||||||||||||||||||||||||||||||||||||||||||||||||||||||||||||||||||||||||||||||||||||||||||||||||||||||||||||||||||||||||||||||||||||||||||||||||||||||||||||||||||||||||||||||||||||||||||||||||||||||||||||||||||||||||||||||||||||||||||||||||||||||||||||||||||||||
|
|
|||||||||||||||||||||||||||||||||||||||||||||||||||||||||||||||||||||||||||||||||||||||||||||||||||||||||||||||||||||||||||||||||||||||||||||||||||||||||||||||||||||||||||||||||||||||||||||||||||||||||||||||||||||||||||||||||||||||||||||||||||||||||||||||||||||||||||||||||||||||||||||||||||||||||||||||||||||||||||||||||||||||||||||||||||||||||||||||||||||||||||||||||||||||||||||||||||||||||||||||||||||||||||||||||||||||||||||||||||||||


 A
A
 B
B